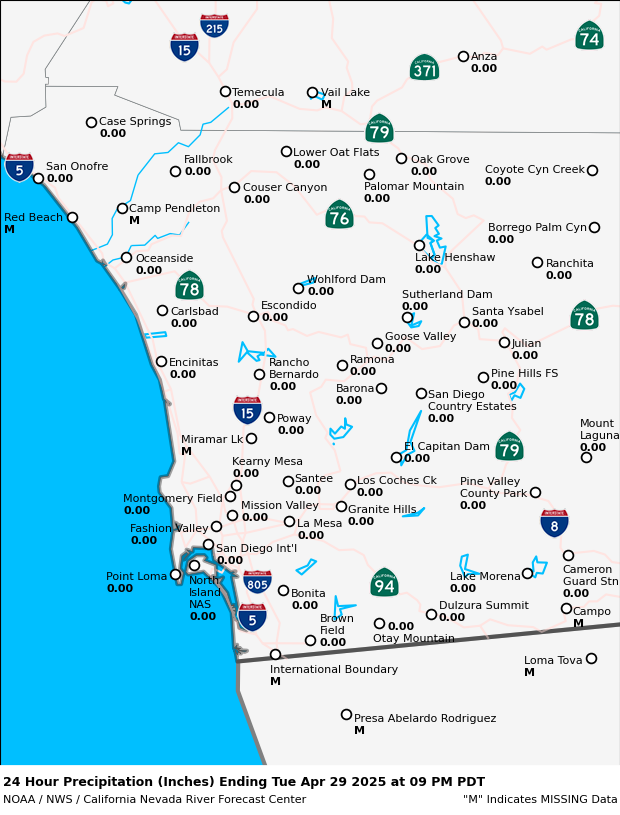
| 24 HOUR RAIN TOTALS SAN DIEGO COUNTY - UPDATED HOURLY |
 |
| 24 HOUR RAIN TOTALS SOUTHERN CALIFORNIA - UPDATED HOURLY | |
 |
ADVERTISEMENT
| 24 HOUR RAIN TOTALS IN CALIFORNIA - UPDATED HOURLY |
 |
| 7 DAY RAIN TOTALS IN CALIFORNIA - UPDATED 8 AM |
 |
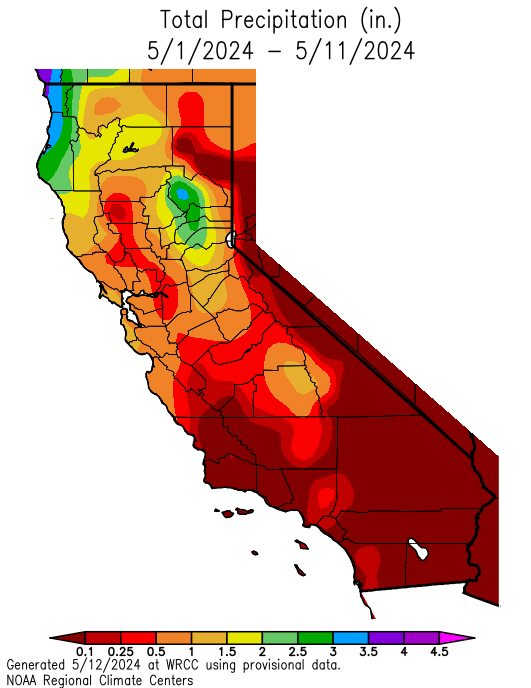
| RAIN TOTALS SO FAR THIS MONTH IN CALIFORNIA - UPDATED DAILY |
 |
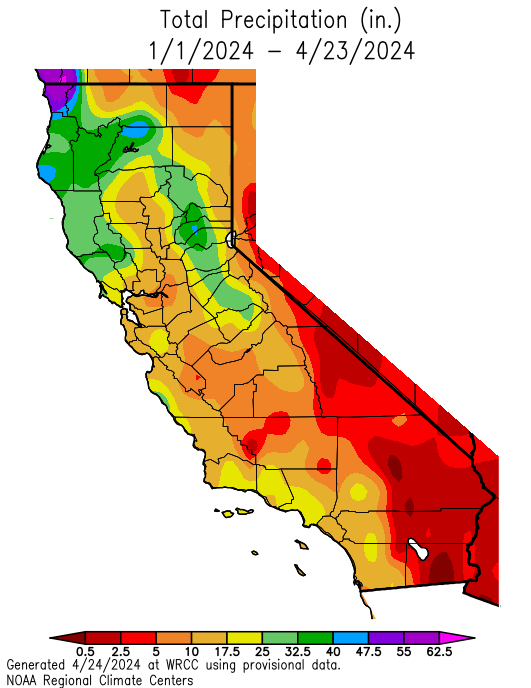
| RAIN TOTALS SO FAR THIS YEAR IN CALIFORNIA - UPDATED DAILY |
 |
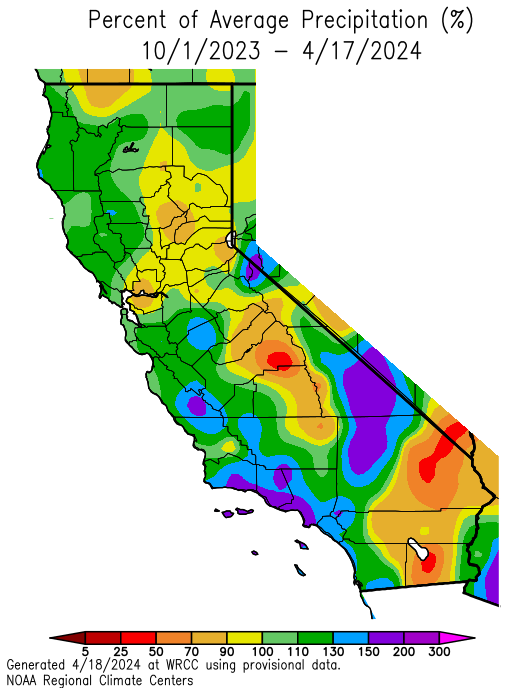
| PERCENT OF AVERAGE RAINFALL SO FAR THIS YEAR IN CALIFORNIA (A GOOD WAY TO SPOT AREAS THAT ARE WETTER/DRIER THAN NORMAL) |
 |
| RAINFALL SO FAR THIS RAIN SEASON IN CALIFORNIA |
 |
| PERCENT OF AVERAGE RAINFALL SO FAR THIS RAIN SEASON IN CALIFORNIA (ALSO A GOOD WAY TO SPOT AREAS THAT ARE WETTER/DRIER THAN NORMAL) |
 |

Hi Everyone! Recently comments haven't been posting to the blog. I think it's some kind of bug within Blogger. I decided to delete everything and start fresh. Hopefully this works!
ReplyDeleteI love this site! Very informative! Thanks!
DeleteGlad you like it!
DeletePossible we can get different time intervals? 1 week, 1 month etc?
DeleteStill loving the site and loving the addition of the 7 day total!
DeleteTesting one two
ReplyDeleteNice! :)
DeleteWe are looking for proper modulation. It is when the green dot…..
DeleteIt is a green type of tube
DeleteI've always been wondering why comments were stuck in 2015 :-D Waiting for the rain to hit us in Rancho Penasquitos later today
ReplyDeleteHaha, yeah, I should probably refresh comments at least once a year.
DeleteYeah!!! We 2026 NOW!!!
DeleteHoping today's storm will help this drought.
ReplyDeleteRain is back!
ReplyDeleteI love this site!
It's my favorite time of the year!
DeleteAlways happy to see rain totals in San Diego
ReplyDeleteMan, I saw the new comments and thought for a brief moment that they were finally ordered the other way around
ReplyDeleteI wish! Blogger doesn't have this as an option. Maybe if I had more programming skills, haha.
DeleteIt's snowing in the Sierra Nevadas. Hooray! We need the snowpack. But also wishing travelers a safe journey. If possible, it would be good to stay home for a few days.
ReplyDeleteSome of the higher peaks in the Sierra could get almost 10' of snow...impressive!
DeleteThank you for the clear and detailed forecast. The maps you provided are very helpful. This is by far the best weather information source there is. Bob
ReplyDeleteThanks for the feedback!
DeleteThank you for the nice rain Lord!
ReplyDeletevery happy we got over an inch in our area!
DeleteSeriously! Loving this new weather pattern. We need more rain!
DeleteThis is amazing insight. Thank you for putting this together.
ReplyDeleteWe have a drought buster going on! El Cajon, CA. Christmas Eve 2021
ReplyDeleteWe are extremely lucky to get this rainy pattern in a La Nina year. We'll take whatever we get! More rain is headed this way over the next few days.
DeleteThis is an amazing resource. Thank you. I will check it regularly.
ReplyDeleteGlad you like the website!
DeleteGreat site, people think I'm so smart having all the current data. Smart site.
ReplyDeleteHaha, glad you like it!
DeleteJust found your site and bookmarked it. Thanks for a great resource!
ReplyDeleteThanks for stopping by!
DeleteCan someone tell me what the current San Diego rainfall total has been so far for December of 2021? And if possible, what is the average rainfall for December in San Diego?
ReplyDeleteThank you in advance!
I'm currently out of town, but will post a month review when I return. In addition, I'll post my annual recap of the year.
DeleteBoth Wunderground and Fox5 were forecasting some big rains for 12/29-12/30 but it just fizzled out
ReplyDeleteIs this due to a new weather pattern that we are not yet familiar with? It seems all the rain got pushed up North
The system rode the coast as it moved south. It's going to bring the LA region a few inches of rain. Unfortunately, afterward, it is going to pull most of the heavy rain southward. A few showers are still possible through today and tomorrow, but it won't amount to much. Around .25" coastal and inland, near an inch in the mountains.
DeleteDang I'm listening to the rain on the Monday evening... It's really nice to get some rain. I feel it was completely unexpected though, i had checked the Fox5 website earlier. It's the second downpour that was unexpected within a week
ReplyDeleteIt's been a challenging weather pattern for sure, though I mentioned the rain chance in this blog post from Saturday :)
Deletehttp://sandiegoweathercenter.blogspot.com/2022/01/weather-update-saturday-1-15-2022.html
The 7 day rain totals image is stuck on the same picture for a couple of months.
ReplyDeleteFixed it. Thanks for the heads up!
DeleteWhy is there no data about the monsoon rains that we've been having - July and August, 2022?
ReplyDeleteI've spent the last few months getting my brewery built in downtown, so I've been on a hiatus. Things have calmed down somewhat now that we are open, so I should be ready for updates this upcoming rain season!
DeleteWow! Your own brewery in downtown San Diego. So glad for you. I just found the name in your About section -- "East Village Brewing Company." And found your website -- that's a great location on Park Blvd by the ball park.
DeleteLooks like you are getting ready to open -- let us know when you do. Will definitely stop by. Those frosty mugs sure look tempting on these scorching days we're having.
Do you think you could reverse the order of comments so that the newest are first?
ReplyDeleteI wish! Blogger is annoying about this.
DeleteFinally some socal rain action
ReplyDeleteDid comments quit working again?
ReplyDeleteHooray! Snow is on its way to the Sierra Nevadas this Friday. Will be checking the last map (percent of average rainfall so far this rain season) to see if we get some "greening" of those red and orange areas up north.
ReplyDeleteHello, would it be possible to have a map showing maybe a 3 year average precipitation? Or a line graph for the past few decades?
ReplyDeleteThat's a good idea. I have the 30 year averages in the climate section of this website. But a timeline would be nice.
DeleteExcited for these storms. Any idea if this will continue in Jan and Feb?
ReplyDeleteThe active pattern should last for a couple more weeks. It might slow down by the second half of this month. Long term, we are still in La Nina, which usually equates to overall dry conditions. Hopefully it erodes by the end of this season.
DeleteSince the overall pattern is La Niña for this season and if our current weather “erodes” it by the end of the season, then will we be more likely to have an El Niño season next season?
DeleteAaron, great maps, thanks. Re La Niña; if the jet stream continues to funnel storms toward us due to its dip, and tapping into the SW for moisture, I would think the LN vs EN cycle is not as important? Regardless, nice to see the rain.
DeleteValid question! There are always exceptions to the rule - you can have a wet La Nina, or a dry El Nino. When talking climate, you need to look at 30 year averages. Generally speaking, La Nina brings dry conditions to SoCal, however, this winter has been interesting to say the least. The La Nina is rapidly weakening to neutral conditions, so it makes you wonder if that's contributing to these rainy conditions.
DeleteAaron, thank you for these maps! I visit every day during the rainy season to see how we are faring.
ReplyDeleteMe, too! Thanks and I'm checking a lot! :)
DeleteThanks for the feedback! I always love this time of the year. Everything is starting to turn green again!
DeleteRecent maps looking better. Hoping for more rain!
ReplyDeleteAgree!
DeleteAaron, we miss your narrative forecasts at the top of the "HOME" page before a rain event.
ReplyDeleteCame here to say that
DeleteThanks, Aaron!
DeleteI still post updates, though they aren't as often. I've been busy trying to get this brewery started. I plan to keep this blog going!
DeleteWhat is the name of your brewery? I love this site and would love to check out your brewery!
DeleteEast Village Brewing in downtown SD. Stop on by!
DeleteThis page is awesome! I have had it bookmarked for several years and always come back to it. The data is amazing! Thank you!
ReplyDeleteMe also. Look at this site every morning, every day.
DeleteMy favorite weather graphs! Thank you! Is there a place where we can find this raw information, eg rain by day at each weather station?
ReplyDeleteKiller site, any chance adding drought status
ReplyDeleteGood idea, I'll add it!
DeleteHope it rains cats and dogs this week! Tired of hearing we have no water on the news.
ReplyDeleteAnd thanks for the site! It is my go to.
ReplyDeleteSo if I read this right, San Diego has has about 15" of rain since 01 Oct 2022? Is that correct? And if so, what is the AVERAGE rainfall for the same period?
ReplyDeleteThe average rainfall totals for SD is 10 inches per year (October-September).
ReplyDeleteWe are above the average now and we have 7 months left to go. We could realistically get 2-4 more inches of rain in the next few months (March-May) and end up with 12-15 inches or so for the rainy season which would make this a very good year for rain just like 2020 (12 inches total). Last year we only got about 5 or 6 inches of rain for the year. This is a great site!
I typically avert this site during dry rain seasons because it make me feel bad. This year I'm checking it multiple times a week 🤣
DeleteMy Golden Hill rain gauge has totalled just over 13" between September '22 and March '23.
DeleteMy weather station in Scripps Ranch is showing 19.11” since Oct 1 as of March 30th.
DeleteThat should have read as of March 20th. Typo.
DeleteWill the rainfall throughout the rest of the state make up for the snowpack that the rains affected? How much of the pack has been lost due to flooding?
ReplyDeleteWe've already hit 12-15 inches in the rainy season in the greater San Diego area from October thru 3/1. I would be surprised if we don't hit at least 20 inches, if not more by May. Many storm systems dropped 3-5 inches and there were at least 4 major storms over the last 3 months. Just last night/this morning in Escondido we've hit 2.5 inches with more projected early next week. I grew up in Seattle and this year has almost felt like the NW (almost).
ReplyDeleteHey Aaron! Can you explain the rainfall deficit hole in the Yosemite/Kings Canyon area of the PERCENT OF AVERAGE RAINFALL SO FAR THIS RAIN SEASON IN CALIFORNIA map. Is this a sensor anomaly or what?
ReplyDeleteIt's definitely bad data, which creates that illusion!
DeleteI've been wondering about that "rainfall deficit hole" as well. It appears centered around Lake Thomas A Edison. I've done some searching, but can't find any mention of this phenomenon or what may be causing it. (BTW, love checking this site every day!)
ReplyDeleteI don’t know Aaron, I am used to you posting before any rain event so I’m doubting everyone who says there will be over 1” this weekend.
ReplyDeleteWell, how about now? ;-}
DeleteThanks for your update
ReplyDeleteDid these update after the tropical storm?
ReplyDeleteHe did post just before the storm hit, so all the indicators lined up. I was concerned he was so busy with his brewing that he put this blog on the back burner, glad to see it isn't the case.
ReplyDeletehi
ReplyDeleteHello?
DeleteThanks for amazing content
ReplyDeleteSlow start for winter '23-'24 - at least down here in SoCal. Do you think it has to do with the delayed seasons that we have been having this year or are we in for a warm & dry winter?
ReplyDeleteGreat question. El Nino is still going strong, however, it doesn't guarantee a wet winter. The current storm track really isn't that great for big rain events. I don't see it breaking for at least another couple weeks. In the meantime, we might see occasional rain chances.
DeletePerhaps you're right and we'll see the rain delayed to late winter. We'll see!
Can you add Alpine to the map? Thx!
DeleteDoes not appear the ytd or season to date charts are fully updated considering how much rain was dropped yesterday 1/22/24...
DeleteI made the comments regarding YTD and STD, disregard as I just noticed that the graph header is through 1/21/24... it's the details that trip me up, great blog!
DeleteAfter every rain event, I will post rain totals across the area. Alpine is definitely on that map. Thanks for stopping by!
DeleteIt looks like those statewide maps update every day in the afternoon. It's a tad slow, but very good data!
DeleteThe last storm really gave a boost to the rain totals for the season. Rain total since Oct 1 went from 2.18” before the weekend to 5.55” this morning.
ReplyDeleteForgot to add, that’s per my weather station in Scripps Ranch.
DeleteNice!
DeleteThat's great news, we need it! More is headed this way for the first week of February.
DeleteGreat that San Diego County looks like it’s caught up to the expected rainfall for the season. It would be better though if the Sierra Nevada mountains seasonal totals were better, since that’s the state’s water supply. Snowpack is improving, but still below average so far.
ReplyDeleteFingers crossed…
It's been a bad year for snowfall all along the Western US. I have farmer friends in Yakima who are worried about the lack of snowpack. Let's hope for improvement!
DeleteNicely presented. Thanks! Distinguishing between yearly and seasonal.
ReplyDeleteThanks!
DeleteQuestion for you (by the way I love this page, I’ve followed for years) - for the percent rainfall of the year/season, is that point in time or for the entire time period?
ReplyDeleteTo clarify: is San Diego at 150-200% of its average annual rainfall for February, and that number will slowly drop if we have a dry month or two, or as of February, we already have 150% of rainfall for the entire year?
Title is “Percent of Average Rainfall So Far…” so I would assume the latter. I am curious to know though how “average” for the year/season is calculated. Is this over the last decade? Or the last 20 years? Or ???
DeleteI meant, I would assume the former, not the latter.
DeleteGreat questions! The first is for the calendar year starting January 1st, while the other is for the rain season starting on October 1st. Climatology is always based on a 30-year average, so the numbers are compared to the previous 30 years.
DeleteGlad you like the blog and reach out with any further questions!
Thanks for the updates on the Home page
ReplyDeleteWould be cool to see charts or graphs for year over year overlays on top of each other ?
ReplyDeleteKinda redundant considering this measures the 30years rolling before, but might give more micro rainfall data- say for the last 5 years overlayed to see the wettest year over the past five - and how that compares to average 30 years rolling in its 5 year timeframe from the past…. After typing this I realize that’s a tall ask seems like a lot of work.
Great site and maps! Thanks for sharing this
ReplyDeleteinfo.
Where the rain at?!
ReplyDeleteTruuuu
DeleteAnyone know how much rain we are supposed to get this weekend? Jan 25th and 26th, 2025
ReplyDeleteMy home weather station in Scripps Ranch measured 0.43"
ReplyDeleteThis week's storm brought just over 2" inches of rain to Scripps Ranch. Looks like there was a lot more in the SD foothills and mountains.
ReplyDeleteWould it be an easy lift to add a % of average snowpack chart? This site is great and I like seeing where we are with rain, but am also interested in snowpack because of the importance for California. The clarity in which you present the data is not matched by other sites, which is why I ask.
ReplyDeleteThere is a state resource here with that info for the Sierra-Nevada mountains, our main source of California's water supply:
ReplyDeletehttps://cdec.water.ca.gov/snowapp/sweq.action
That is a good page for the info I'm looking for. Thanks!
DeleteThis one is pretty good to, if you're looking for resources for the state's overall current water supply situation:
Deletehttps://cdec.water.ca.gov/resapp/RescondMain
Both great resources for sure!
DeleteThe rain gauge for Encinitas has been very inaccurate over the last month or so. It rained at least .50-.75" last night in Encinitas and surrounding areas (other nearby areas reported approx .75") yet the amount shown this morning for Encinitas was only .19". Similar innacurracy over the last couple of storms.
ReplyDeleteInteresting. I wonder if the rain gauge is broken?
DeleteThank you for your hard work
ReplyDeleteIt's my pleasure!
DeleteThis is awesome information!!! Thank you for your hard work!!!
ReplyDeleteThanks! Even though I'm tied up at the brewery, I still enjoy tracking the weather!
DeleteHi Aaron, thank you for your continued work on this site, even tho you have a big boy job with the brewery!
ReplyDeleteHaha, yeah, the brewery takes a lot of my free time. With that said, I still enjoy forecasting the weather!
DeleteLove this! Thank you!!!!
ReplyDeleteYou bet!
DeleteLooks like a good soaker is on the way for the next week plus. Hoping the mountains get 5-10” to fill up the reservoirs.
ReplyDeleteLet's hope! It's an interesting pattern that's setting up for the start of rain season. Surprisingly active!
DeleteEase the burden on the Colorado and stave off the water rate hikes.
ReplyDeleteAmen!
DeleteHere we go! Lets get some snow and rain for Christmas.
ReplyDeleteIt's always good to see rain. Hopefully the flooding will be minimal in our area. Up north near LA, those mountain areas will get slammed.
DeleteI wish we'd see snow, but unfortunately, it's too warm!
Ive noticed that san diego frequently gets less rain than predicted and storms are frequently revised to have less rain as they get closer. Meanwhile LA seems mostly accurate.
ReplyDeleteI am I wrong about this? And if not, is there a reason for this?
Rain totals were generally about 1 to 2" less than expected, even in LA. I think most forecasters were worried about downplaying this event because of the flooding that occurred in Northern CA earlier in the week. In that case, rainfall forecasts were too low.
DeleteI'm surprised how low rain totals were in our mountains. Pretty crazy.
Hi Aaron, been a visitor since 2015. Love the site.
DeleteIs there anyway to know the specific locations of where rain data is collected in any listed city? thanks.
DeleteI'm glad you like the site and I appreciate the support! I still love tracking the weather!
Delete@pete: Is there a specific station you're trying to find. I think each surface reporting station has a lat/lon if I remember correctly.
DeleteThere are so many micro climates. Would be fun to know my proximity to nearest reporting station.
ReplyDeleteThe bottom 2 graphs seem to be wrong or not updated. We have received just under 7 inches of rain since October and it’s still showing less then 5”. Thanks
ReplyDeleteNoticed the same thing, in fact all 5 of those graphs seem to have incorrect data right now. Rain totals this year too high and the rest too low. Interesting
ReplyDeleteLooks like it’s fixed now!
ReplyDeleteI noticed it was incorrect too, but you're right, it looks like the data has been adjusted!
Delete